Price history graph

Editorial Team
Editorial Team
Updated: 3 July 2026
Our price tracking history shows when and how often stores change the price of a product.

Editorial Team
Editorial Team
Updated: 3 July 2026
Our price tracking history shows when and how often stores change the price of a product.
The price history shows whether today’s price is good or bad. Because it shows when prices go up and down, you can see whether you should act straight away or perhaps wait for the moment. The price history helps you make better buying decisions. It shows the lowest price over time for the variant that has been cheapest at each point in time.
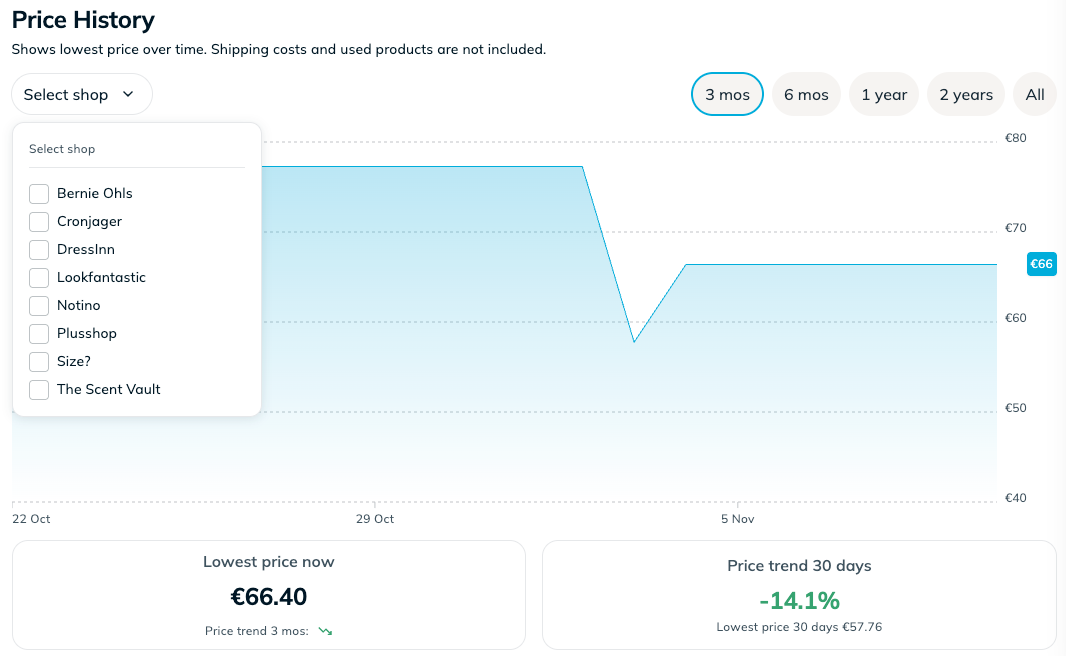
It can happen that shops raise and lower prices just before a campaign to make their offers seem extra good. With the help of our price history, you can see whether the price is really as good as it looks.
You always have the price history to hand. It is visible on the product pages, and you can easily see how the price has changed over time, both on your computer and on your mobile phone. The price history shows the lowest prices of the day over time for shops that allow price information to be saved, giving you transparency on market prices.
At present, only Amazon’s prices are excluded in line with the terms of the Amazon Affiliate Programme.